Career Research Data Graphs
In
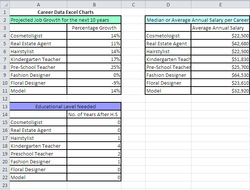
this assignment I had to create graph based off of research I did earlier this
year. I had to make a graph of Average Annual Salaries, Projected Job Growth,
and Years in college or school needed. In order to complete this assignment I
had to create a chart in Excel, I had to create three graphs in Excel. I needed
to know how to format both the charts and the graphs. By accomplishing this
assignment I learned that I want to be a Kindergarten teacher. In this
assignment I think I formatted the graphs well for this. To improve my work
next time I could format the charts different.
Career Glog
In
this assignment I had to make a glog on glogster.edu. Our glogs had to
represent our number one job for our Career Research. For this assignment I had
to learn how to use glogster to complete it. By finishing this assignment I
learned how to use Glogster as a new tool. In this assignment I think I
decorated the glog nicely. If I were to redo this assignment I would make the
colors a different theme.
Video: Career Research Movie
